
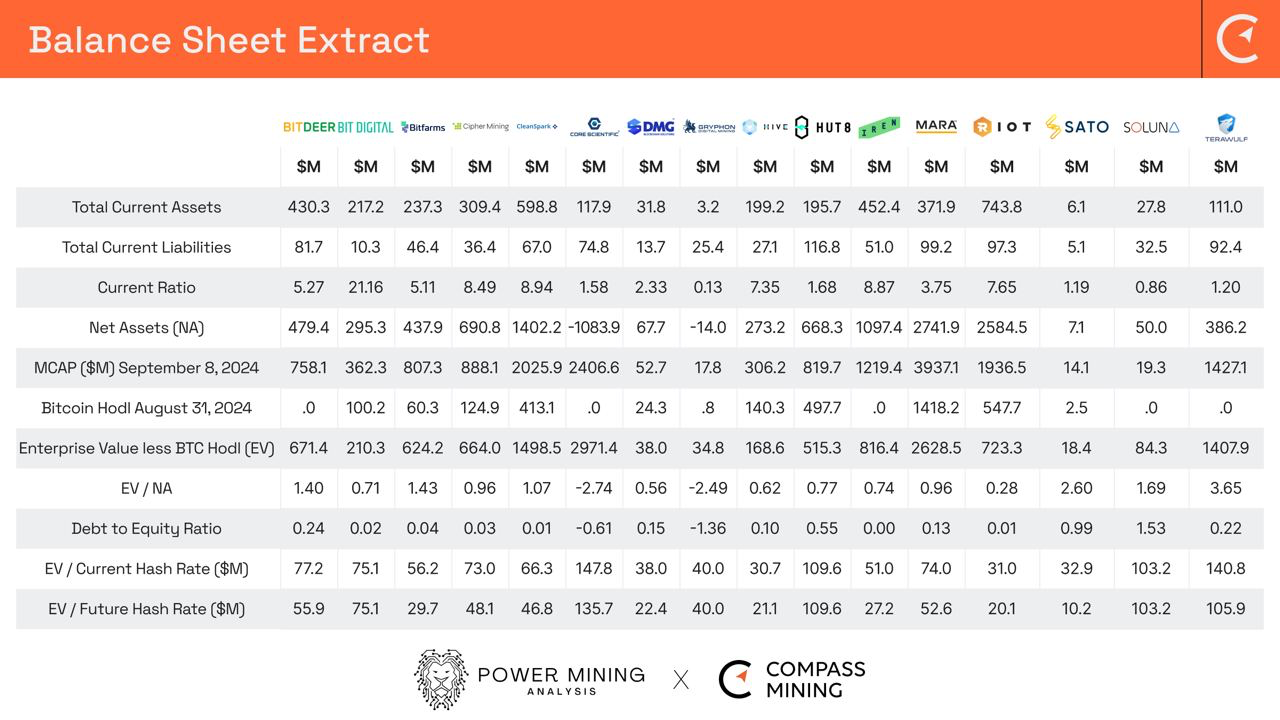
With Bitcoin miners having recently released their earnings for the second quarter which ended on June 30, 2024, now is an opportune time to review each Bitcoin Miner's respective Balance Sheet strength to determine who has the ability to manage longer and lower volatile hash prices during this post halving period.
The table below focuses on using the following five valuation metrics to compare 16 of the largest North American Bitcoin miners:
- Current Ratio
- Enterprise Value (EV) / Net Assets (NA) Ratio
- Debt to Equity Ratio
- EV / Current Hash Rate
- EV / Future Hash Rate
Current Ratio
Assessing publicly listed Bitcoin mining companies using the current ratio provides valuable insight into their short-term financial health and liquidity. The current ratio, calculated by dividing current assets by current liabilities, measures a company’s ability to meet its short-term obligations. For Bitcoin mining companies, which operate in a volatile and capital-intensive industry, a strong current ratio indicates they can withstand market fluctuations and cover operating expenses without relying on additional debt or asset sales. Conversely, a low current ratio may signal liquidity risks, making the company more vulnerable to sudden Bitcoin price drops or operational disruptions.
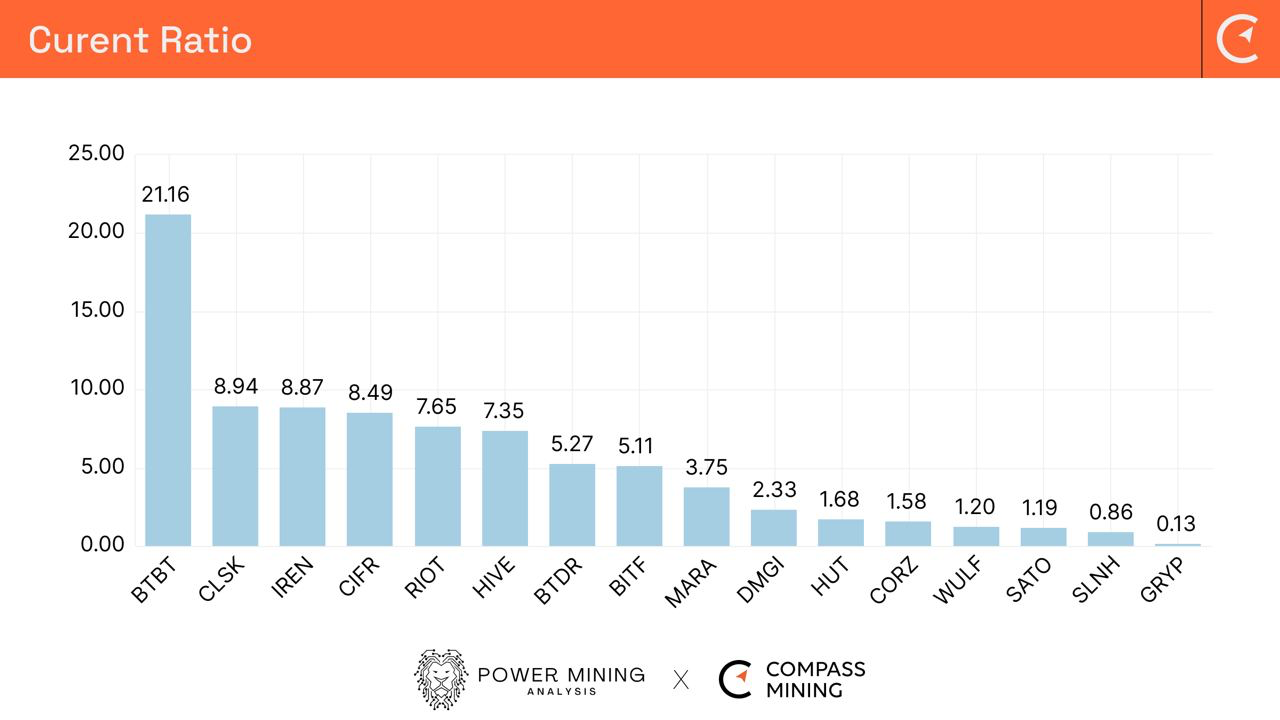
The table highlights that Bit Digital (BTBT) has literally no debt on the Balance Sheet, except for a number of small leases and therefore with a strong treasury of cash and cash equivalents, Bitcoin and Ethereum holdings, provides a current ratio of 21.16. CleanSpark (CLSK), IREN (IREN) and Cipher Mining (CIFR) all have a ratio in excess of 8, highlighting their strength to manage their business commitments over a longer period than 12 months. A ratio greater than 1.0 would effectively provide a reasonable assumption that there is sufficient strength to support financial obligations over the next 12 months.
Soluna Holdings (SLNH) and Gryphon MIning (GRYP) with a current ratio of 0.86 and 0.13 could indicate that each company may struggle to meet its short-term obligations. However, some companies operate efficiently with low current ratios due to strong cash flow, fast inventory turnover, or access to other forms of liquidity.
Equally, a high current ratio can indicate inefficient asset use, suggesting the company is holding excess cash or idle assets instead of reinvesting in growth, improving profitability, or optimizing operational efficiency.
Enterprise Value (EV) to Net Assets Ratio
The EV to Net Assets ratio offers key insights into the market potential of a Bitcoin mining company beyond its physical assets. Net Assets represent the value of tangible assets such as mining equipment and Bitcoin reserves, while EV accounts for market capitalization, debt, and cash reserves, reflect broader market sentiment.
In the volatile Bitcoin mining industry, where prices and speculation heavily impact valuations, a higher EV compared to Net Assets often signals market confidence in the company’s future growth. Conversely, a smaller gap may indicate more conservative investor expectations. A ratio below 1 could suggest the company is undervalued, potentially making it attractive to investors, or it could indicate financial distress or declining asset quality.
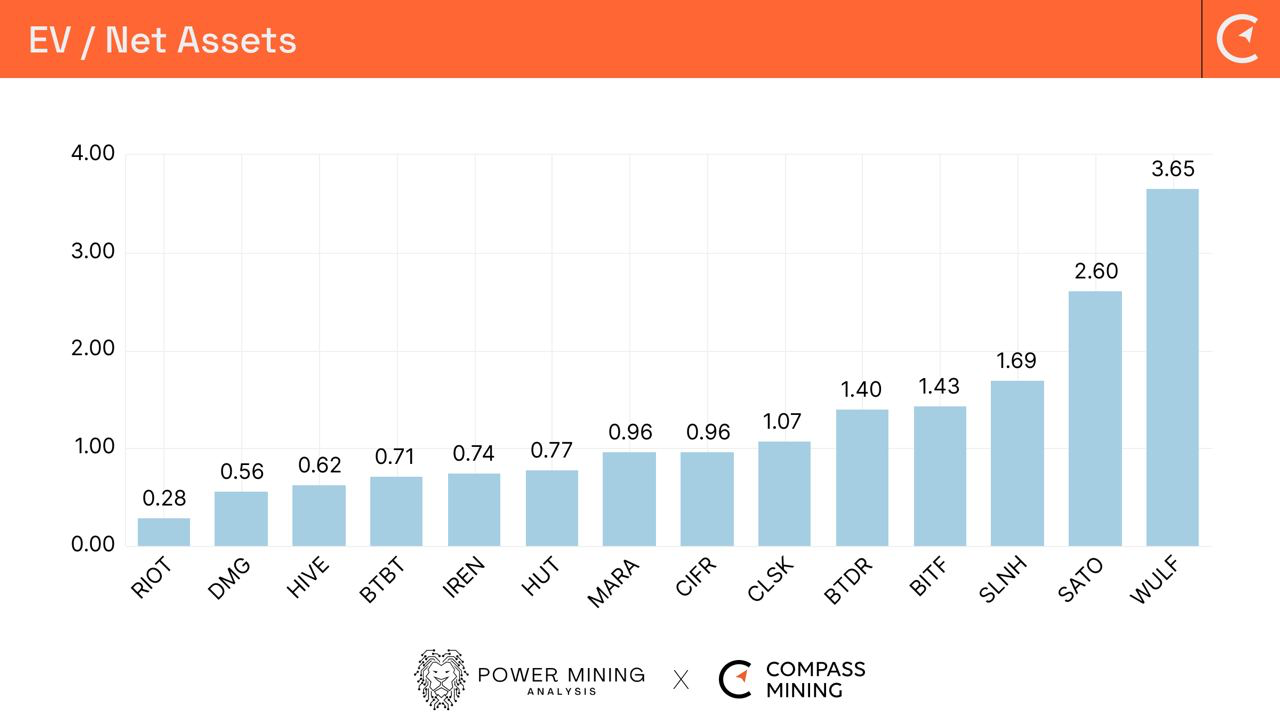
Many miners with energy Power Purchase Agreements (PPAs) are also required to hold substantial cash reserves as collateral or to hedge against price volatility. This ensures they can meet payment obligations and manage operational risks effectively.
Riot Platforms (RIOT) has a ratio 0.28 indicating that for every $0.28 invested, their investor is getting a return of $1 in net assets, thereby suggesting the company is undervalued in comparison to peers miners. Their hash rate is expected to grow in excess of 200%, this year alone, aided by the energization of their flagship facility at Corsicana and recent purchase of Block Mining. More than half the miners in the graph highlight a lower EV when compared to net assets.
For the likes of TeraWulf (WULF) with a ratio of 3.65, the market could be factoring a significant future announcement. It is no secret that the company has been preparing to deliver a High Performance Computing (HPC) solution.
Debt to Equity (D/E) Ratio
The D/E ratio is a crucial metric when analyzing Bitcoin miners, as it reflects the company's financial leverage and risk profile. Bitcoin mining is capital-intensive, requiring significant investment in hardware, facilities, and energy. A high D/E ratio may indicate the company is heavily reliant on debt to finance operations, which could be risky in the volatile Bitcoin market. Conversely, a lower D/E ratio suggests the company is using more equity to fund growth, reducing financial risk. Investors use this ratio to assess the company’s stability and its ability to weather market downturns or price volatility.
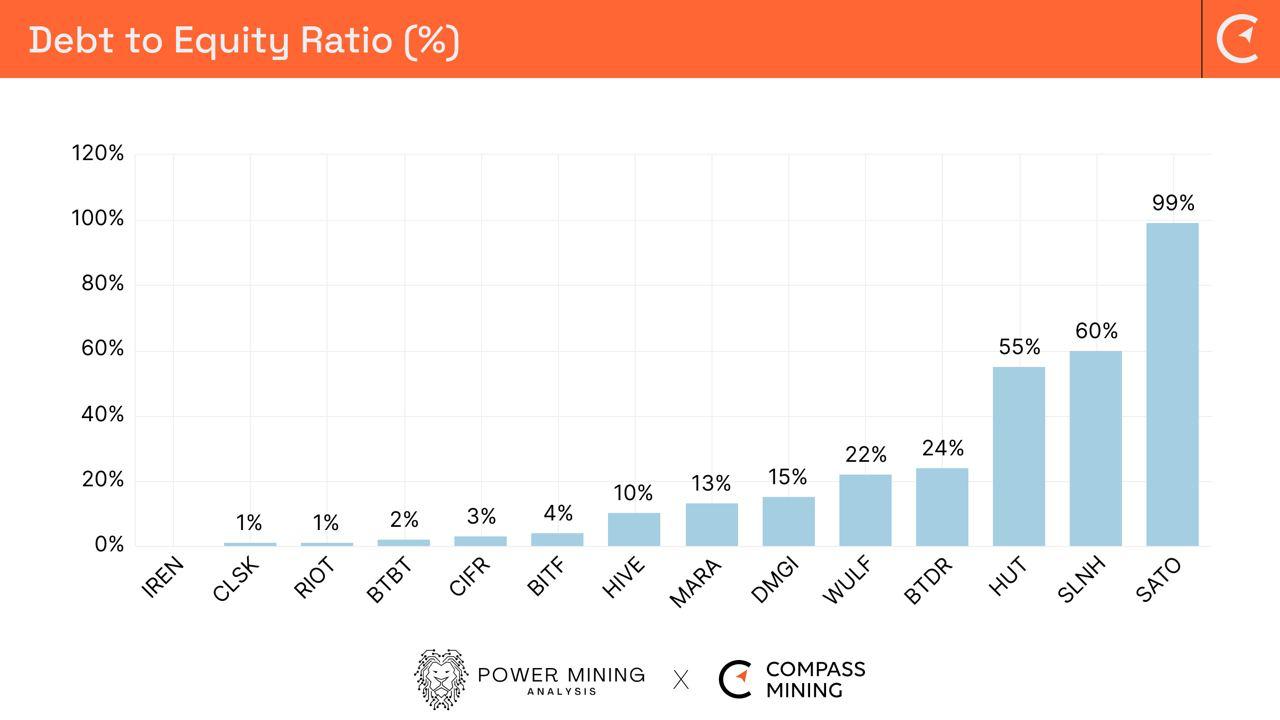
Many of the North American miners made the mistake of taking on significant debt to fund their hash rate growth, during the last bull cycle, in 2021, to their detriment. Miners have since been adopting alternative strategies such as the dilution of shares and selling Bitcoin production to fund growth.
IREN, having learned from its previous miner loans, with NYDIG, now has effectively zero debt on its balance sheet. CleanSpark, Riot Platforms, Bit Digital, Cipher Mining and Bitfarms all have less than 10% of debt to equity, currently, on their respective balance sheets.
With the announcement of further HPC deals, raising debt may become more accessible to acquire in a more predictable market, thereby providing more opportunities for Bitcoin Miners to grow.
Enterprise Value of Current Hash Rate ($M)
The EV divided by Hash Rate ratio provides a useful metric for comparing the valuation efficiency of different Bitcoin mining companies. This ratio reflects how much the market values each miner's operational capacity to generate Bitcoin, expressed in terms of their computational power (hash rate).
A lower EV/Hash Rate suggests that a company is undervalued relative to its computational power, potentially making it an attractive investment. A higher ratio indicates the market assigns more value to the company's hash rate, possibly due to factors like efficiency or expected future growth.
Comparing EV/Hash Rate between miners allows investors to assess which companies are more efficient in converting their mining power into enterprise value. A company with a lower ratio might be perceived as more operationally efficient or better positioned to generate revenue.
If two companies have similar hash rates but one has a higher EV, the market may expect stronger future profitability or strategic advantages, such as lower energy costs, better technology, or superior scaling potential. Ultimately, this metric helps investors compare how much they are paying, in terms of enterprise value, for each unit of hash rate capacity across different Bitcoin miners.
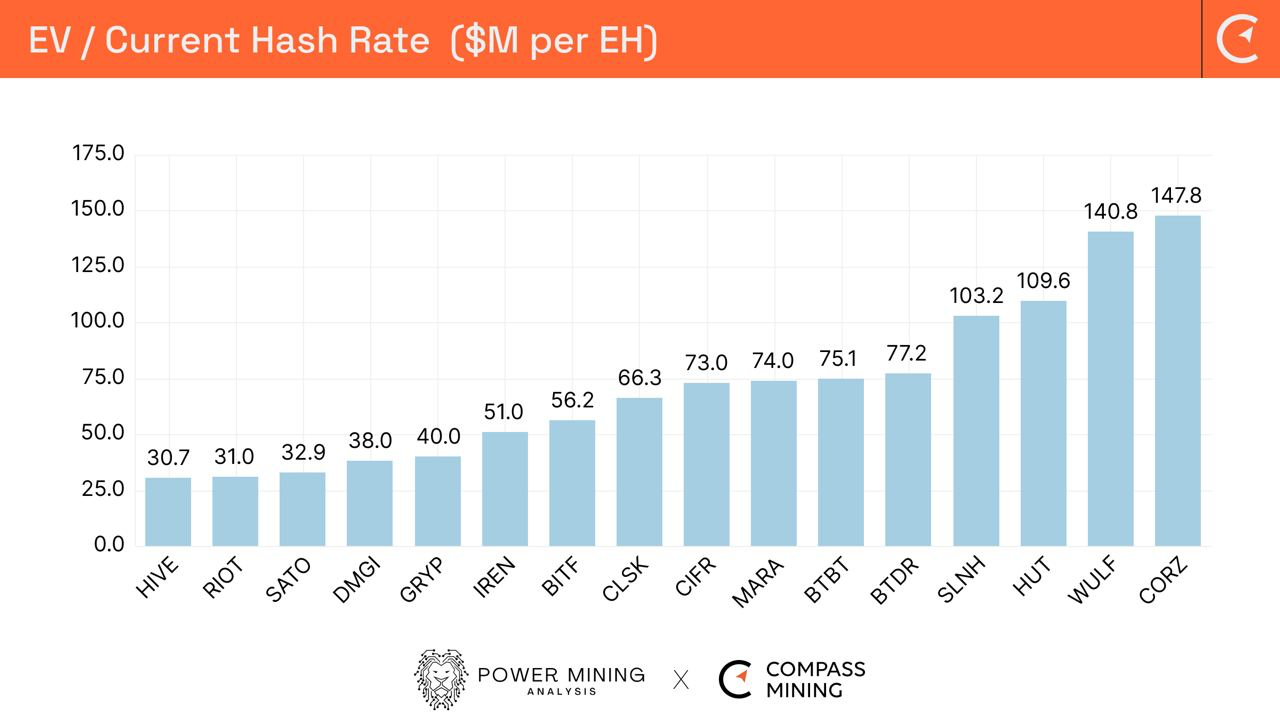
In terms of current installed hash rate Hive Digital (HIVE) has a current value of $30.7 million per EH/S, closely followed by Riot Platforms and SATO Technologies (SATO). It should be noted that many of the miners in the graphic above have significant revenue streams from other non self-mining activities, such as hosting, management services, HPC hosting, HPC and Artificial Intelligence (AI).
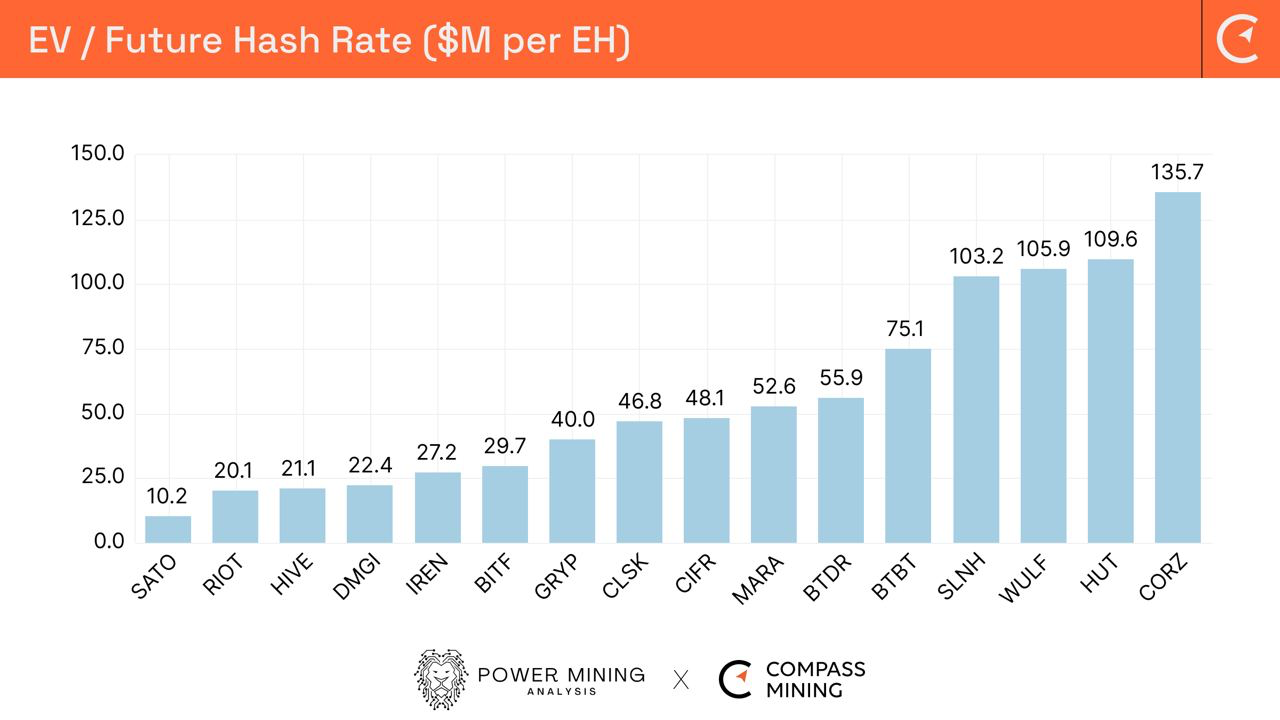
Using the target hash rate for December 31, 2024, SATO Technologies, with a projected hash rate of 1.8 EH/s, has a cost value of $10.2 million per EH/s. Riot Platform, Hive Digital, DMG Blockchain (DMGI), and IREN each have values below $30 million per EH/s. In contrast, Soluna Holdings, TeraWulf, Hut 8 (HUT), and Core Scientific are valued at over $100 million per EH/s. Notably, these higher valuations are influenced by significant future revenues from non-mining operations. A few months ago, industry analysts estimated a floor valuation of around $100 million per EH/s.
Assumptions and Subsequent Events
The data used in these tables and graphs was provided from recent 10K/10Q and equivalent submissions from overseas companies along with August monthly operational updates, as follows:
- Market Capitalization and Enterprise Value as at September 8, 2024
- All Balance Sheet data in terms of Cash and Cash Equivalents and debt as at June 30, 2024
- Bitcoin and Etheruem Hodl values as at August 31, 2024
- Bitcoin and Ethereum Price as at September 8, 2024
It should be noted that TeraWulf has since reported the repayment of their total debt, whilst Core Scientific (CORZ) has recently issued $460 million of convertible notes to help reduce the more expensive debt on the balance sheet and converted $260 million of convertible notes to equity. These transactions have not been included in the tables above.